

Detailed Customs Data by Country Reveals Emerging Trade Opportunities
2026-11-17
Most trade reports stop at the border—the real opportunities rarely do. Country-level customs data shows exactly where demand is shifting, which suppliers are gaining ground, and which markets still have room for new entrants. Instead of guessing from aggregated figures, importers, exporters, and analysts can follow shipment-level signals as they emerge. Tendata turns this detailed customs intelligence into a practical view of buyers, competitors, and supply routes. In this post, we unpack the trends hiding in country-specific trade flows and how to act on them before they become obvious.
Importers Are Paying More per Unit in a Handful of Product Lines
Unit costs are creeping up in a short list of categories that rarely make headlines. Fasteners, ceramic capacitors, and certain woven technical textiles have all moved against the broader softness in freight rates, leaving buyers with invoices that look reasonable at the container level but less forgiving once the numbers are broken down by piece or meter.
Much of the increase is being buried in revised minimum order quantities, shorter payment windows, and tighter tolerances that factories now price separately. Instead of renegotiating the full contract, suppliers are shifting the burden onto specific SKUs where buyers have fewer alternatives. The result is a quiet repricing that does not show up clearly in average import indices.
For purchasing teams, the practical effect is that comparing shipment totals no longer captures what is happening. Several importers now track landed cost per unit for these lines on a monthly basis, because a stable average can hide a sharp rise in the handful of parts that actually drive production.
Smaller Supplier Countries Are Gaining Share Without Much Notice
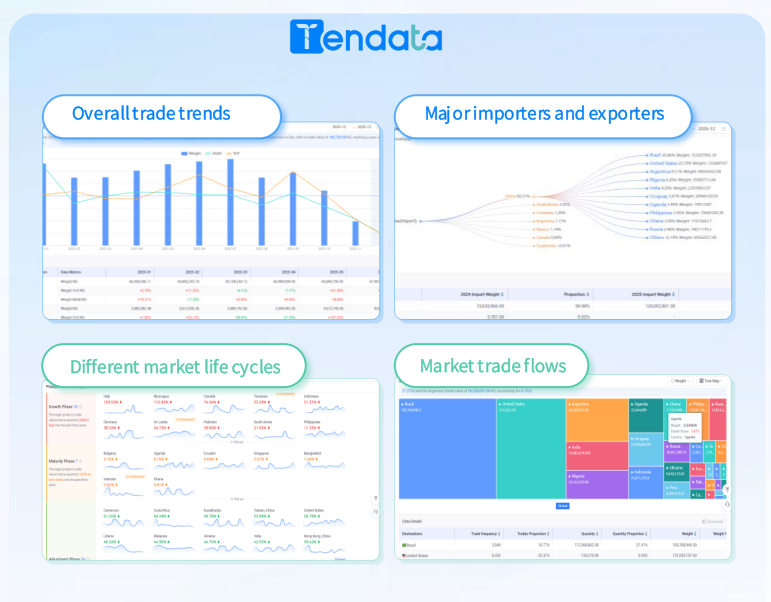
The map of who supplies what is changing in a way that rarely gets a second glance. Small and mid-sized producer countries are taking share from the usual export giants, not through sudden disruption but through dozens of modest order shifts that build up over time. On their own, these moves look like noise; together they point to a slow rebalancing.
Part of the reason this goes unnoticed is that buyers tend to test quietly. A company will place a trial order in a smaller market, see whether the goods clear customs without trouble, and then quietly raise the volume. Those decisions are rarely announced in public, and they do not require a radical change in sourcing policy. Over a year or two, though, the share held by those secondary origins becomes harder to ignore.
For established suppliers, the pressure does not come from a single rival country suddenly overtaking them. It comes from the combined weight of many smaller players that are individually modest but collectively reshaping the options available to global buyers. That is why watching only the largest supplier countries gives an incomplete picture of where competition is actually building.
Shipment Frequency Tells a Different Story Than Total Volume
Looking only at total volume can paint a misleading picture. Two suppliers might each move ten thousand units in a quarter, yet one ships twice a week while the other sends a single massive batch at the end. Those patterns create wildly different pressures on warehouse space, inventory turns, and cash flow. Frequency reveals whether a product is moving steadily through the pipeline or sitting in limbo until a bulk release.
A high total with low shipment frequency often points to poor production planning or batch-driven bottlenecks. The receiving team faces sudden spikes, dock congestion becomes routine, and safety stock gets inflated to cover long gaps. On the other hand, a lower total shipped in consistent, smaller intervals tends to support leaner operations. Buyers may react to the raw number and assume a supplier is performing well, while the real story hides in the cadence.
When comparing lanes, customers, or suppliers, pairing total volume with shipment frequency changes the conversation. A regional account with modest volume but daily shipments can be more valuable than a national account with large quarterly drops. Freight planners see this immediately: frequent, predictable flows are easier to consolidate, route, and schedule. The total tells you how much moved; the frequency tells you how smoothly it moved.
Repeat Orders From Unfamiliar Buyers Are Becoming a Pattern
It used to be easy to dismiss a one-off order from a name you didn't recognize. But when the same unfamiliar buyer returns within weeks with a slightly larger order, it stops looking like chance. The shipping details stay consistent, the product choices overlap, and the payment arrives without the usual back-and-forth. That kind of quiet repetition is beginning to feel less like random traffic and more like a deliberate buying pattern.
Some of these repeat buyers turn out to be small resellers testing demand before committing to bulk. Others are sourcing on behalf of a client and keeping their own identity in the background. A few simply prefer to move fast and avoid relationship-building conversations. What they share is a habit of returning only when the first order went smoothly: the item matched the listing, the package arrived on time, and nothing about the transaction created friction.
The practical takeaway is not to treat every unknown repeat buyer as a risk or a high-value account. Instead, watch the gaps between orders, note whether the quantities are climbing, and keep the early transactions clean. If the pattern holds, the second or third order often reveals more than the first one ever could.
Second-Tier Ports Show Growth That National Averages Hide
Look beyond the headline numbers for the country's busiest container gateways and a quieter pattern emerges. Places like Mobile, Alabama, and Wilmington, North Carolina, are handling cargo at rates that would have seemed improbable a decade ago. Their expansion rarely makes national news, partly because the sheer volume moving through Los Angeles or New York dwarfs almost anything else. Yet when those giant ports sputter—whether from labor pauses, weather, or congestion—shippers have increasingly routed boxes through these smaller facilities. The result is steady, compounding growth that gets buried when analysts average all ports together.
What makes the second tier interesting is not just the percentage increases, which can look dramatic on a small base, but the infrastructure catching up. Dredging projects, new container yards, and direct rail links have turned former niche docks into viable alternatives for regional distribution. Ports in the South Atlantic and Gulf have been particularly aggressive, chasing cargo that once moved inland by truck from distant hubs. Shippers, for their part, care less about rankings than about reliability. A port that clears a vessel in two days instead of five can win business even if it handles a fraction of the national total.
Aggregate statistics also hide the shift in where growth is happening. A single megaport gaining three percent may add more actual containers than a smaller port doubling its throughput, so the national average stays reassuringly flat. But that flatness tells an incomplete story. For importers and exporters located away from traditional gateways, the second tier offers shorter inland hauls, fewer choke points, and sometimes lower total landed cost. Over time, these advantages chip away at the dominance of the largest ports. The national average may not move much, but the map of American trade is being redrawn one container at a time.
Early Commitments Suggest Where Demand Has Room to Run
Early commitments are less a verdict than a set of footprints. When customers agree to take capacity well before it is available, the underlying message is usually that existing options are tight, expensive, or both. Those early reservations tend to cluster where the pain is sharpest, and they often reveal more about what buyers are trying to escape than about the exact product they intend to buy.
The useful signal sits in the distance between signed volume and the wider pool of potential users. A small number of anchor commitments can point to demand that has not yet turned into public orders because price, reliability, or access remain unresolved. Watching how those commitments spread across regions and buyer types offers a rough gauge of where the next wave of adoption is likely to appear once capacity catches up.
Reading early commitments strictly as a ranking of winners misses their real value. They function more like an outline of strain, marking the places where some buyers are already willing to pay a premium or accept rigid terms to secure supply. Those are the segments most likely to absorb new output quickly, and the ones where demand still has room to run.
FAQ
Watch for sudden increases in shipment volume from a smaller supplier country paired with stable or rising unit prices. Also look for new HS code combinations appearing for the first time, since these often indicate a buyer testing a new source.
Declared value, quantity, unit of measure, port of entry, country of origin, and importer or exporter names where available. Unit value is especially useful because it reveals whether growth is driven by price changes or by actual volume.
Compare at least twelve consecutive months and check whether the same commodity keeps moving through the same route. A real shift usually survives seasonal dips and shows repeat buyers, not just one large spot shipment.
Regional groupings can hide which country is actually gaining share. If Vietnam is exporting more but Thailand is losing ground, a regional average may look flat. Country-level records expose the source of change and help you decide where to place suppliers or sales efforts.
When a product moves from one country to a hub and then onward to a final market, the direct trade data may understate the real demand. Tracing these routes can reveal unmet demand in the final market or opportunities to bypass the hub with direct supply.
Monthly is ideal for fast-moving consumer goods and components. For industrial equipment or seasonal products, quarterly reviews are usually enough. Consistency matters more than frequency because the value comes from spotting changes against your own baseline.
Treating every increase in export value as rising demand. A spike can come from higher raw material costs, a weaker currency, or one large project shipment. Always check quantity and unit value together before acting.
Conclusion
Trade records parsed by country are starting to show a few quiet shifts that headline figures tend to flatten. Importers are paying more per unit in a handful of product lines, which usually means either supply is tightening or specifications have changed, yet the higher prices haven’t shown up clearly in overall totals. At the same time, smaller supplier countries are gaining share without much attention. Their absolute volumes remain modest, but the consistency is enough to notice. Shipment frequency adds another angle, since some buyers now order more often in smaller batches while others consolidate purchases, so relying on total volume alone can miss how buying behavior is actually changing. Repeat orders from unfamiliar buyers are also becoming a pattern, and that is not the kind of thing one-off spot purchases would produce.
Second-tier ports reinforce the same impression. Growth at these locations is often masked by national averages, even though port-level customs entries show steady gains. Early commitments, such as advance bookings and contracted volumes, point to where demand still has space to expand, especially in lines where unit prices are rising and buyers keep returning to less established suppliers. None of this is uniform across countries or product categories. That unevenness is precisely why country-level customs data matters, it separates short-term noise from repeatable early movement and can reveal openings before they become visible in broader trade statistics.
Contact Us
Contact Person: Grace
Email: [email protected]
Tel/WhatsApp: +86 18721992033
Website: https://www.tendata.com